Best Greyhound Betting Sites – Bet on Greyhounds in 2026
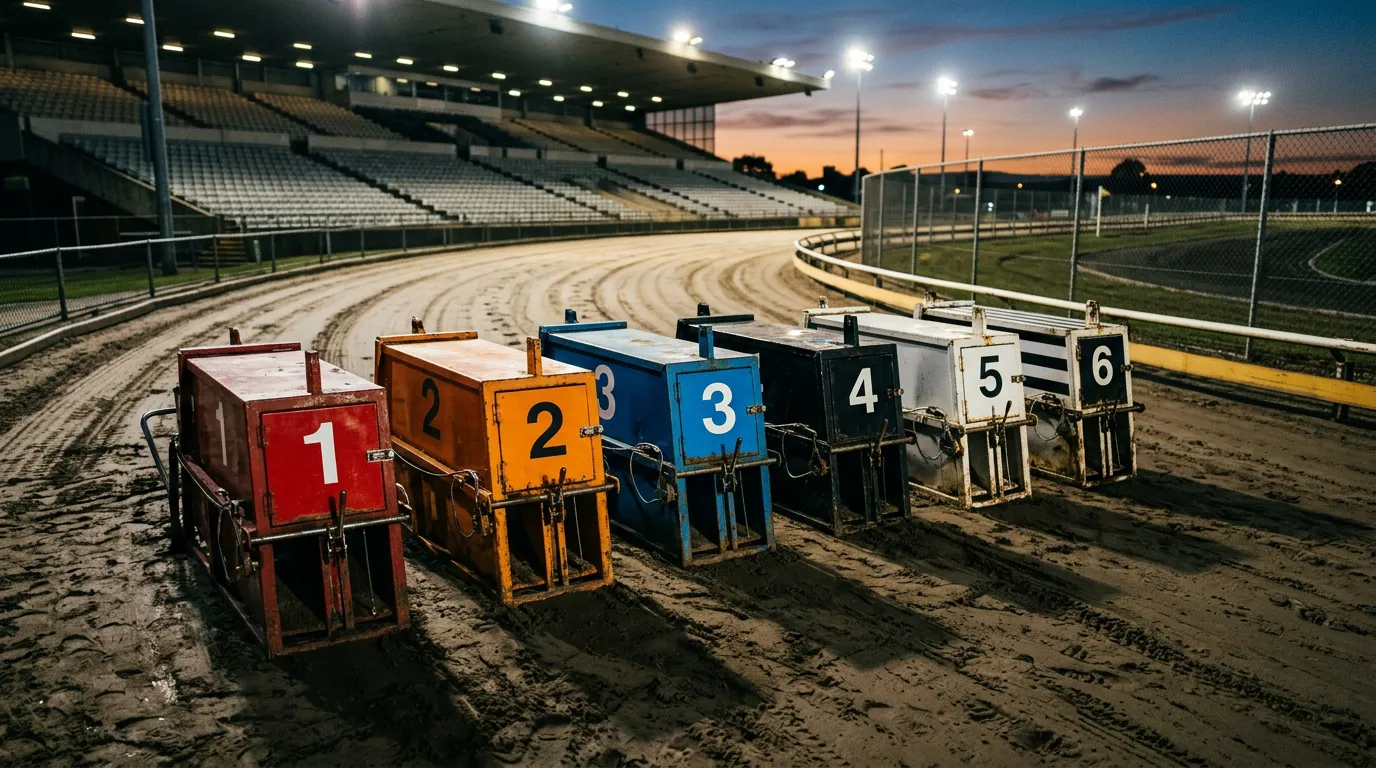
Romford trap statistics reveal patterns that separate informed bettors from those playing guesswork. Every greyhound race begins with six dogs in six traps, but the assumption that each starting position carries equal weight ignores the physics of track geometry. At Romford, where the 350-metre circuit and 67-metre run to the first bend create specific crowding dynamics, understanding trap bias becomes a genuine edge.
Position is power in greyhound racing. The data shows consistent advantages and disadvantages tied to where a dog starts, and these patterns hold across thousands of races. What follows breaks down the numbers trap by trap, examines how distance affects bias, and translates raw statistics into practical betting application. The percentages might seem marginal at first glance, but marginal advantages compound over time.
Trap-by-Trap Performance at Romford
In a perfectly neutral race, each trap would win roughly 16.6% of the time. Reality at UK tracks diverges significantly from this theoretical baseline, and Romford follows the broader pattern with some track-specific nuances.
Trap 1 consistently outperforms expectations. Analysis from The Game Hunter places the red box win percentage at around 18-19% across UK tracks, a margin of two to three percentage points above fair odds. At Romford, the rail advantage manifests clearly: dogs breaking from trap 1 face no interference from the inside and can establish racing room immediately. The first bend comes early enough that securing the rail becomes tactically decisive.
Trap 2 runs close to expectation or slightly above. The orange box benefits from proximity to the rail without the same certainty of claiming it. Trap 3 holds particular interest for statistical analysis. Data from Oxford Stadium suggests trap 3 averages approximately 18% win rate across UK circuits, making it the most consistently successful middle position. The blue box allows early pace dogs to angle for rail position without the crowding that often affects traps 4 and 5.
Traps 4 and 5 tend to underperform. Dogs from these middle-outside positions face the worst of both scenarios: insufficient track to angle inward before the bend, and no rail advantage to protect. At Romford’s compact circuit, where positioning happens fast, these traps produce more crowding incidents and checked runs.
Trap 6, the striped box on the extreme outside, presents a different profile. While it lacks rail advantage, it offers clear running room. Strong early-pace dogs drawn wide can sometimes use the extra space to build momentum, though converting this into victories requires specific running styles. The statistics show trap 6 performing closer to par than traps 4 and 5, sometimes slightly above on particular tracks.
These percentages translate directly to market value. A dog with genuine 16.6% win probability priced at odds reflecting 18% probability offers overlay. Conversely, backing trap 1 dogs at prices that already factor in the bias means paying for information the market has absorbed.
How Trap Bias Changes Across Distances
Romford offers five racing distances: 225, 400, 575, 750, and 925 metres. Trap bias shifts meaningfully across this range, reflecting how track geometry interacts with race length.
Sprint races over 225 metres amplify trap bias to its extreme. The entire race covers barely one circuit, meaning dogs have minimal opportunity to recover from poor breaks or early crowding. First bend position often determines finishing position. Trap 1 carries its strongest advantage here, while traps 4 and 5 face maximum disadvantage.
The standard 400-metre distance represents the bulk of Romford racing. Trap bias remains significant but allows slightly more racing to develop. Dogs completing nearly one-and-a-quarter laps have marginally more scope to overcome positioning challenges, though the first bend still dominates outcomes. The rail advantage persists throughout; dogs establishing inside running save ground on both bends.
Middle-distance racing over 575 metres introduces stamina as a factor. While trap draw still matters at the break, race shape becomes more fluid. Strong closers drawn wide can sometimes overcome early positioning deficits if front-runners tire. The second and third bends offer overtaking opportunities that don’t exist in sprints. Trap bias, while present, shows more variance at this distance.
Staying trips of 750 and 925 metres represent different racing entirely. These two-lap-plus races reward pace judgement and stamina over raw early speed. Trap bias flattens considerably, though inside draws maintain a ground-saving advantage through multiple bends. The longer format allows racing skill and fitness to overcome positional disadvantage, making pure trap statistics less predictive.
For bettors, this distance variation demands context. Applying the same trap weighting to a 225-metre dash and a 925-metre staying race ignores how fundamentally these events differ. What remains constant across all distances, however, is the importance of reaching the first bend in good position.
The First Bend Factor
Romford’s 67-metre run to the first bend compresses the battle for position into a brief, decisive window—shorter than many UK tracks and consequently more influential on race outcomes.
Timeform analysis indicates that the greyhound leading at the first bend wins approximately 35% of races. This statistic applies across UK tracks but gains particular weight at Romford where the short run-up limits overtaking opportunities. Dogs that fail to establish position by the first bend face the remainder of the race fighting traffic rather than running freely.
The crowding dynamics at Romford’s first bend create predictable patterns. Six dogs converging into racing position over 67 metres produces frequent interference. Dogs from middle traps face the highest collision risk—they must commit to going inside or outside while surrounded on both flanks. Inside dogs can hug the rail; outside dogs can swing wide. The middle traps offer neither escape route.
First sectional times—the split to the first bend—reveal which dogs handle this compression well. Some greyhounds consistently emerge from crowded first bends; others lose lengths whenever trouble develops. Reading a dog’s first-bend history at Romford specifically matters more than their record at tracks with longer run-ups.
The practical implication: trap draw and first-bend running style interact. A front-runner drawn trap 1 represents a different proposition than a slow-starting closer from the same box. The trap creates opportunity; the dog’s characteristics determine whether that opportunity converts.
Putting Trap Statistics to Work
Raw trap statistics provide context, not conclusions. The profitable application comes from identifying when market prices underweight or overweight trap advantage.
Consider a dog with strong early pace drawn trap 1 in a 400-metre race. If the market prices this dog as if trap draw adds nothing, the overlay exists. If prices already reflect a 3-4% trap advantage on top of the dog’s inherent ability, paying that premium offers no edge. Trap statistics inform the assessment; they shouldn’t mechanically dictate bets.
Forecast and tricast betting offers perhaps the clearest application. When predicting finishing order, trap draw affects how dogs will likely race. A speedball from trap 1 followed by a strong railer from trap 2 represents a natural forecast pattern. Two front-runners from traps 3 and 4 creates crowding risk that might let a closer from trap 6 pick up the pieces. Trap statistics inform race-shape prediction.
Track conditions add another layer. Wet tracks tend to favour inside traps more heavily—rail running saves ground, and slippery surfaces punish dogs forced to run wide on bends. Dry, fast tracks show somewhat flatter trap bias as speed differentials matter more than ground saved.
The final consideration involves sample size. Trap statistics derive their validity from large numbers of races. Any individual race contains sufficient variance to produce any result. The edge from trap bias plays out over dozens or hundreds of bets, not on any single selection. Those who expect trap 1 to win because the statistics favour it misunderstand probability. Those who systematically incorporate trap advantage into value assessment over time will see the percentages work in their favour.