
Best Greyhound Betting Sites – Bet on Greyhounds in 2026
Odds are the language of betting. Every price quoted by a bookmaker communicates something about perceived probability, potential return, and where the market believes value lies. Understanding what these numbers actually mean transforms betting from guesswork into informed decision-making—or at least, decision-making informed by the same information everyone else has access to.
Numbers tell the story in greyhound racing. A dog at 2/1 faces different expectations than one at 10/1, and the gap between those prices reflects genuine judgement about relative chances. What follows breaks down how odds work, how to convert them into meaningful probabilities, and how to identify situations where the market might be wrong. None of this guarantees profit, but it does guarantee you understand what you’re betting into.
Fractional and Decimal Odds
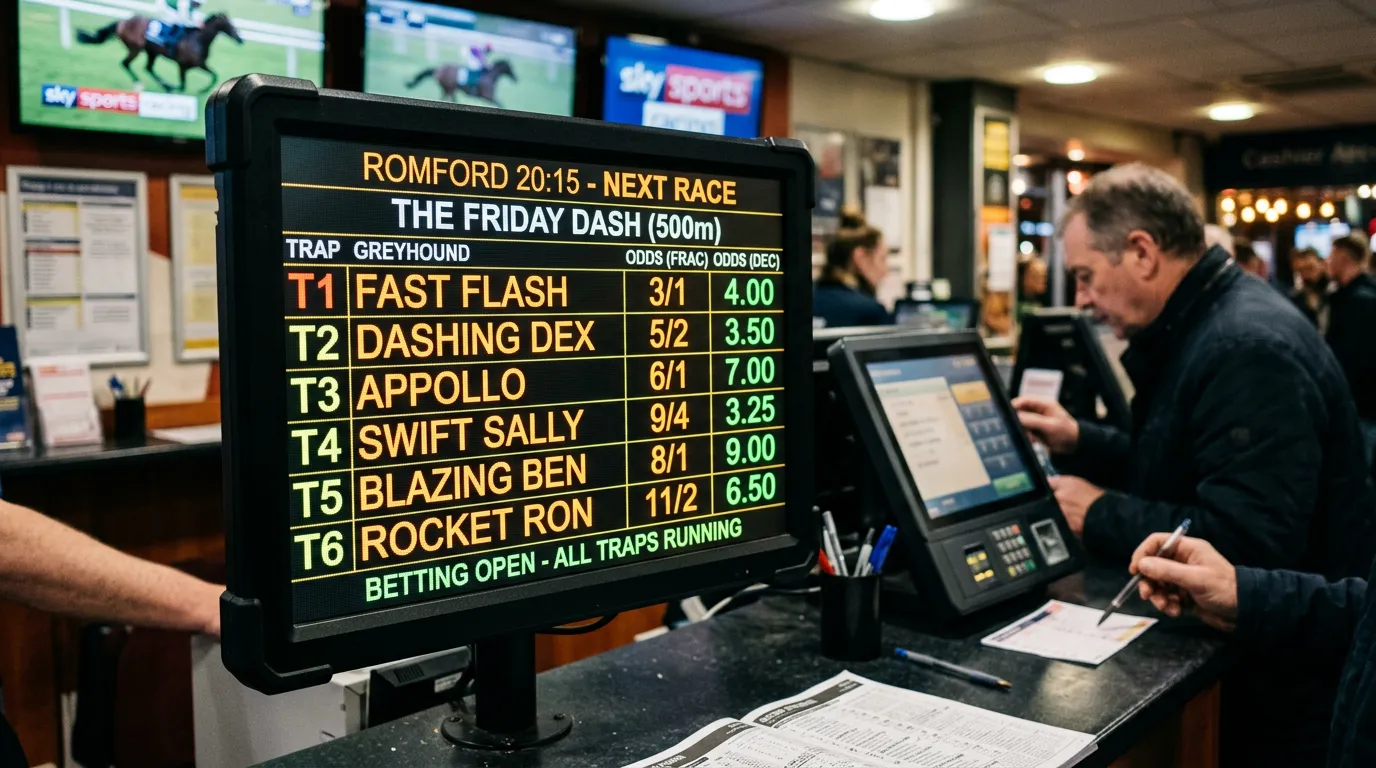
British betting traditionally uses fractional odds—prices expressed as ratios like 3/1, 5/2, or 11/4. The first number represents potential profit; the second represents stake. At 3/1, a winning £10 bet returns £30 profit plus the original £10 stake, totalling £40. At 5/2, the same stake returns £25 profit plus stake, totalling £35.
Reading fractional odds becomes intuitive with practice. The key relationship: when the first number exceeds the second, you’re backing an outsider with potential to return more than your stake in profit. When the second number exceeds the first—odds-on prices like 1/2 or 4/6—you’re backing a favourite whose profit will be less than your stake. Evens (1/1) represents the midpoint: a winning bet returns exactly double your stake.
Decimal odds present the same information differently. Popular in continental Europe and on betting exchanges, decimal odds show total return per unit staked rather than profit alone. Decimal 4.00 equals fractional 3/1—a £10 bet returns £40 total. Decimal 1.50 equals fractional 1/2—a £10 bet returns £15 total. The decimal format makes calculation simpler: just multiply stake by odds for total return.
Converting between formats requires basic arithmetic. For fractional to decimal: divide the first number by the second, then add one. So 5/2 becomes (5÷2)+1 = 3.50 in decimal. For decimal to fractional: subtract one, then express as a fraction. So 2.50 becomes 1.50/1, simplified to 3/2 or expressed as 6/4. With practice, you’ll recognise common conversions instantly: 2/1 is 3.00, 9/4 is 3.25, 5/1 is 6.00.
Most UK bookmakers display both formats, letting punters choose their preference. Online platforms typically default to decimal but allow switching. The numbers mean the same thing regardless of format—only the presentation differs. What matters is understanding the underlying reality: these numbers represent how much you stand to win relative to what you risk.
Converting Odds to Probability
Behind every price sits an implied probability—what the odds suggest about a runner’s chance of winning. Converting odds to probability reveals whether the market considers a dog likely or unlikely to prevail, and by how much.
The formula for decimal odds: divide 100 by the decimal price. At 4.00, implied probability equals 100÷4 = 25%. At 2.00, it’s 100÷2 = 50%. At 1.50, it’s 100÷1.50 = 66.7%. The higher the odds, the lower the implied probability; the lower the odds, the higher the implied chance.
For fractional odds, add the two numbers together, then divide the second number by that total. At 3/1, the calculation runs: 1÷(3+1) = 1÷4 = 25%. At 1/2, it’s 2÷(1+2) = 2÷3 = 66.7%. The results match the decimal conversions, as they must—same price, different notation.
The overround complicates interpretation. Bookmakers don’t price markets to 100%—they build in profit margin by ensuring implied probabilities across all runners sum to more than 100%. A typical greyhound race might price to 115-120%, meaning the combined implied probabilities suggest a 115-120% chance that one of six dogs wins. Obviously impossible, which is why this margin represents the bookmaker’s edge rather than genuine probability assessment.
The favourite win rate of 35.67% in UK graded racing provides calibration. If you convert favourite prices to implied probabilities, you’ll often find figures around 35-45%—roughly matching actual outcomes. This suggests the market prices favourites reasonably accurately overall, though individual races always contain room for disagreement.
Understanding implied probability matters because it lets you compare market judgement to your own assessment. If you believe a dog has 30% chance but the market implies only 20%, you’ve potentially found value. If the market implies 40% and you see only 25%, backing that dog means fighting the crowd. Probability conversion turns abstract prices into claims you can evaluate against your own analysis.
Finding Value in the Odds
Value exists when odds exceed a runner’s true probability of winning. A dog with 25% actual chance offered at odds implying 20% chance (5.00 decimal, 4/1 fractional) represents value. A dog with 20% actual chance offered at odds implying 25% chance (4.00 decimal, 3/1 fractional) does not. The challenge lies in estimating actual probability better than the market.
Mark Moisley, Commercial Director of GBGB, has observed the commercial pressures shaping betting markets: “Horse racing has more injuries per race and more fatalities per race than we do. But the reason they’re not going after horse racing is because it’s better funded.” The funding difference affects market depth and efficiency—greyhound markets sometimes offer opportunities that deeper horse racing markets have already priced away.
Market inefficiency creates value opportunities. Greyhound racing’s rapid-fire schedule means bookmakers price many races daily, sometimes without full attention to detail. Early morning prices for evening racing might not incorporate late information. Smaller meetings attract less betting volume, potentially leaving prices slightly off-true. None of this means easy profit, but it does mean opportunities exist for those paying closer attention than the average punter.
Consistent value identification requires honest self-assessment. If you believe you’ve found value repeatedly but your results don’t reflect it, either your probability estimates are wrong or variance is hiding underlying edge. Over hundreds of bets, genuine value shows in profit. Persistent losses despite believed value suggests the market was right and you were wrong. This feedback loop—betting, tracking, assessing—drives improvement in value identification.
Comparing prices across bookmakers reveals where individual firms might be wrong. A dog at 5/1 with one bookmaker but 4/1 elsewhere suggests either the 5/1 price is generous or the 4/1 price is tight. Taking the best available price—line shopping—extracts every bit of value the market offers, even when overall value might be marginal.
Common Price Points Explained
Certain price points appear constantly in greyhound betting. Understanding what each represents helps you process race cards quickly and identify where your interest lies.
Evens (1/1, 2.00 decimal) represents the break-even point. A winning bet doubles your money; the implied probability is exactly 50%. Dogs at evens are strong favourites but far from certain winners. At this price, you need to win more than half your bets to profit long-term, accounting for the times you lose your stake entirely.
2/1 (3.00 decimal) implies roughly 33% chance. This is comfortable favourite territory—the market believes this dog wins about one in three races. Many punters find 2/1 the sweet spot between acceptable odds and genuine winning probability. A dog at 2/1 carries real expectation of success while offering meaningful return if correct.
5/2 (3.50 decimal) and 3/1 (4.00 decimal) represent the borderline between favourite and outsider. Dogs at these prices are competitive but not dominant. They might win frequently enough to build confidence or lose often enough to drain bankrolls. The implied probabilities—roughly 29% and 25% respectively—suggest genuine contention without certainty.
5/1 (6.00 decimal) marks the transition to longer shots. At roughly 17% implied probability, dogs at this price are expected to lose most races but remain capable of winning. Value often hides at this level—the market might underrate a runner whose specific circumstances favour them today even if they wouldn’t usually be among the principals.
10/1 (11.00 decimal) and beyond represents outsider territory. Implied probabilities drop below 10%, meaning these dogs are expected to lose nine times out of ten or more. Occasionally outsiders win—the 35.67% favourite win rate means favourites lose nearly two-thirds of races, and those winners come from somewhere. Backing outsiders suits punters comfortable with frequent small losses and occasional larger wins, though the mathematics demands genuine edge to profit long-term.
Odds-on prices—1/2 (1.50 decimal), 4/6 (1.67 decimal), and shorter—demand high strike rates to profit. At 1/2, you must win two of every three bets just to break even. Hot favourites at these prices need overwhelming superiority to justify backing. When they lose, the damage to betting banks stings disproportionately. Odds-on backing suits high-confidence plays where you’re prepared to accept small returns for high probability of success.